Interviewing
Asking the people who will be using the system what they need, what they want, and what they expect to be able to do with data is an effective and relatively easy way to find out what requirements are needed. Working with stakeholders, clients, and decision makers will give you a better understanding of their needs so you can make better decisions as you determine requirements. Review your work with your stakeholders to discuss your understanding of what the information system will be, and to ensure that you are meeting needs and expectations.
Identify entities, attributes, and relationships
Creating data model mockups can help you to organize data and define the relationships among data elements. Data modeling is a technique used to create a visual representation of your company’s business data, how it’s organized, and how it flows by analyzing and determining the data requirements.
Data mockup modeling is important because it gives you the following benefits:
- Cuts costs and reduces time to market
- Improves business processes and streamlines development, ensuring consistent and high-quality product releases
- Reduces complexities and risks
- Improves collaboration among various teams and stakeholders
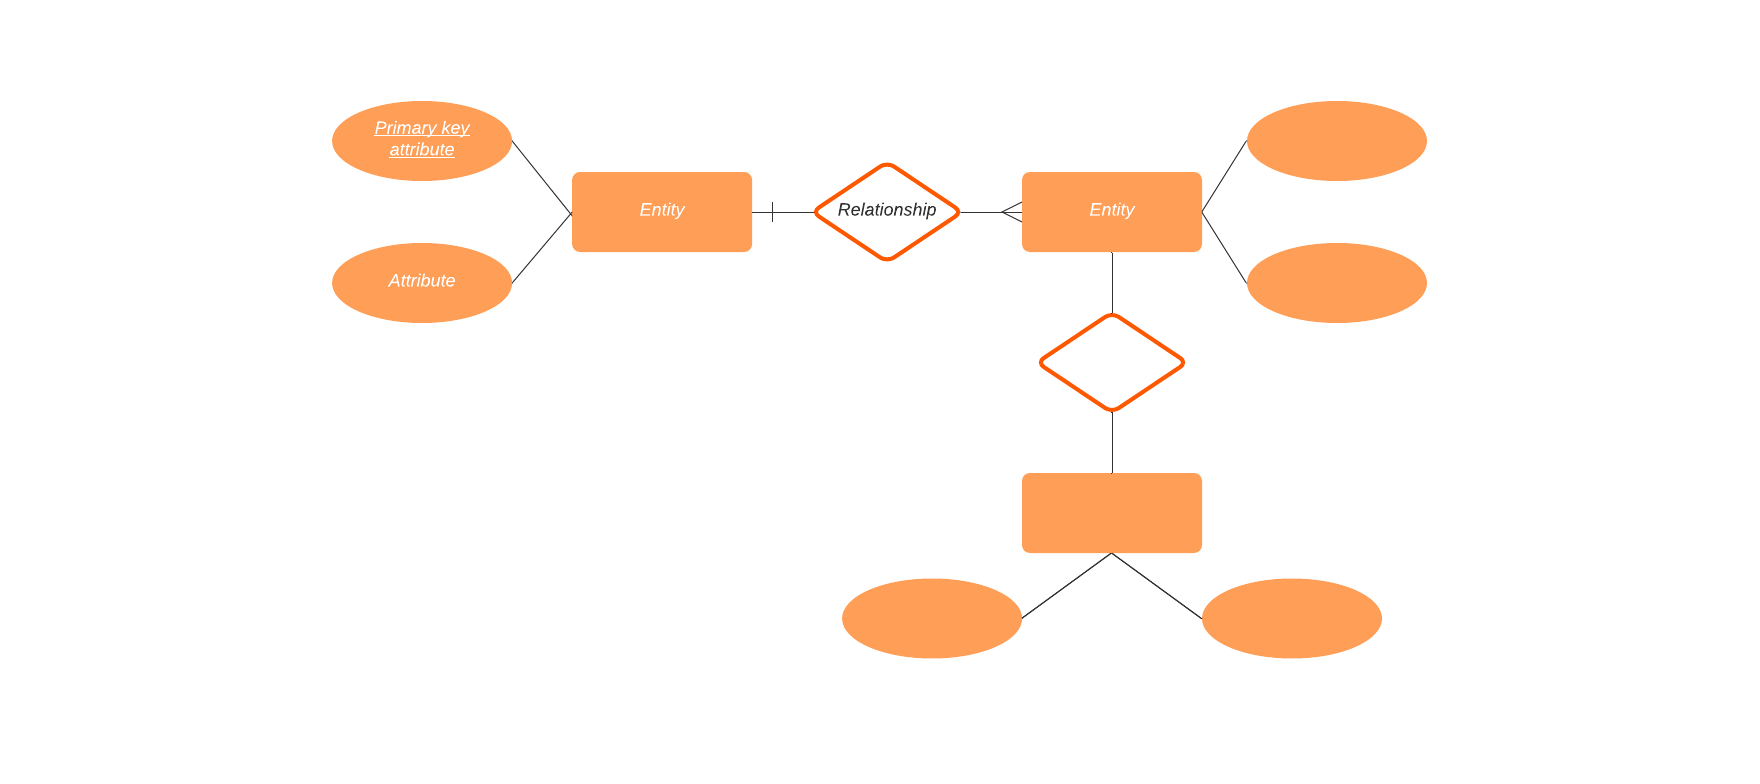
Create an ER diagram
An ER diagram is similar to a data flow chart. You use ER diagrams to document and illustrate the logical structure of your database, and to show how pieces of data (entities) relate to each other in your system.
Think of an entity as a noun. It is something that has data stored about it. For example, a customer or a pizza. Entities have attributes that define characteristics belonging to each entity. For example, the name of the customer entity and the type of pizza entity (cheese, pepperoni, combo, etc.).
Entities can be put into entity sets—a collection of entities that share the same attributes but might have different values for some of the attributes. For example, you might put a lot of Student entities in one set, but the value for each Name attribute will be different.
After you have defined the entities and attributes, it’s time to identify and define the relationships. A relationship describes the connection or association between one or more instances of entity types. Relationships can be thought of as verbs or verb phrases. For example, the customer’s name is Bob. Customer Bob bought a pepperoni pizza.
But you aren’t simply showing a relationship between two entities. You need to define what type of relationship it is. We’ll use entity sets A and B as an example:
- One-to-one: One record in A corresponds to one record in B. For example, a student might be registered in a Physics of Sound and Acoustics course. The student might be enrolled in several different courses but only one Physics of Sound and Acoustics course.
- One-to-many: One record in A corresponds to many records in B. For example, a single car company produces many different car models. But a specific model is built only by a specific car company.
- Many-to-one: Many records in A correspond to at most one record in B. For example, many different students have enrolled in one Physics of Sound and Acoustics class.
- Many-to-many: Many entities in A correspond to many entities in B. For example, many different car companies build many different car models.
ER diagrams use shapes like rectangles, ovals, and diamonds—similar to the shapes you might see in a flowchart—to represent different types of entities, their attributes, and relationships. Specific lines are used to describe entity connections and cardinality (for example relationships that can be described as one-to-one, one-to-many, many-to-many, and so on).
The benefits of creating ER diagrams include:
- They are easy to understand and are useful for communicating requirements and architecture with developers, customers, stakeholders, and end users no matter how technical or non-technical they might be.
- They help you to understand relationships between entities which can help you to find ambiguities or unnecessary processes.
- ER diagrams translate into relational tables which can help you to build databases more quickly.
- Database developers can use the diagrams as blueprints for implementing data in software applications.
- They can be useful in other contexts such as describing relationships within an organization.